Archive
Visualizing complex numbers
I read a few books on math recently, and I learnt something about complex numbers that amazed me.
We are very used to the idea of thinking of real numbers as a line. We draw a line, mark its center as 0, mark all the positive numbers to its right, and the negative numbers to its left. Visualizing numbers as a line is rather obvious, but I have learnt recently that complex numbers can be visualized as points on a 2D plane (and also, more importantly, why that visualization makes sense, which we will come to later in this post). That reminded me vaguely that this was mentioned to me while at school, but I did not really understand the significance of it then (nor do I remember it being explained to me).
Just a quick reminder: complex numbers are the set of numbers which are of the form a+b*i. i here stands for square root of -1 while a and b are real numbers (real numbers include positive and negative numbers including decimal numbers). The key here is that we do not know how to take the square root of a negative number. But we denote it with i which stands for square root of -1. So, now, if you need square root of -16, it would be square root of 16 * square root of -1, which would be 4*i. You can also think of numbers like 3+4i or 2.75+2i and so on. Note that when b (in a+b*i) is 0, that just gives you the full set of real numbers.
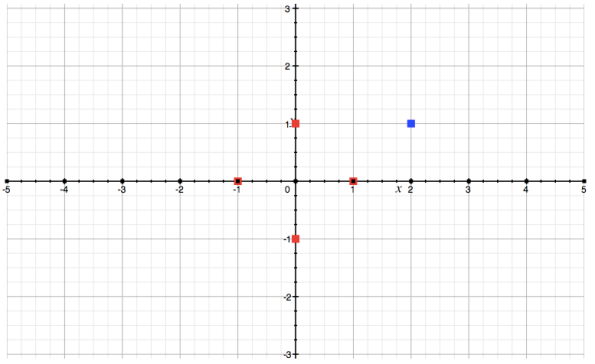
Given that complex numbers are of the form a+b*i, with a and be being real numbers, you can start plotting these points on a 2D graph, by just plotting the points a,b on the graph. For example in the plot below, the blue point is the complex number 2+1*i (I will come to the red points in a second).
If you look at the red points plotted (starting with the one on the axis to the right of origin and going anti-clockwise), they represent points (1,0), (0,1), (-1,0) and (0,-1). These are nothing but the complex numbers 1+0i, 0+1i, -1+0i, 0-1i. Or stated simply, they are :1, i, -1, -i.
All this is straightforward, but you might wonder what the big deal is with plotting complex numbers as points on a 2D graph. What value or what better understanding does it provide?
This is the most interesting part and I learnt about it a bit in the Imagining Numbers, which I linked to at the beginning of this post. Understanding it needs a re-thinking of what numbers really mean.
On the real number line (which would just be the x-axis in the above graph) addition would mean moving the number line to the right or left. For example, adding 2 to all the numbers, would just lead to the number line shifted to the right: 0 would have moved to the position of 2, 1 would have moved to the position of 3, 2 would have moved to the position of 4 etc. On the same lines, multiplication would mean stretching the line. In case of multiplication by 2, 0 would still be 0, 1 would become 2, 2 would become 4, 3 would become 6 and so on. If you plot this new line, it will be the old line but stretched on either side.
But what does multiplication and addition mean with respect to complex numbers? Let us take the simplest example. The number 1, when multiplied by i, becomes i. i when multiplied by i becomes -1 (this is the definition of i, because we defined i as square root of -1). Proceeding further -1*i would be -i and -i * i would be 1 (this is because -i*i would be -(i*i) which is -(-1) which would be 1). This we come back to where we started from.
These 4 points have been plotted in the above graph in red. If you see now, you will realize that multiplication by i just means that the plane is rotated by 90 degrees. Multiplicating again by i, will rotate the plane again, and so on till it comes back to the same position after doing it 4 times (by when we would have rotated it 360 degrees).
Now reading about it might be difficult, but I fully understood it when I saw this video below. The goal of the video is something different, but most of it is spent on explaining how to look at numbers in this new perspective. This video is extremely good and I have been sharing it with people I know. I have not understood this video fully (towards the end), but watch it till at least the 5 mins 10 seconds mark, it is a great explainer.
You might need to watch it a few times to grasp it fully, but please do so. I guarantee you that you will see a whole new way of looking at numbers, once you grasp the idea.
That is really all I have got for now. But it also makes me wonder, is there any sense in which we can extend numbers to use the 3D space or even more dimensions? What would such number systems be?
